- Happy Rewards
- March 10, 2026
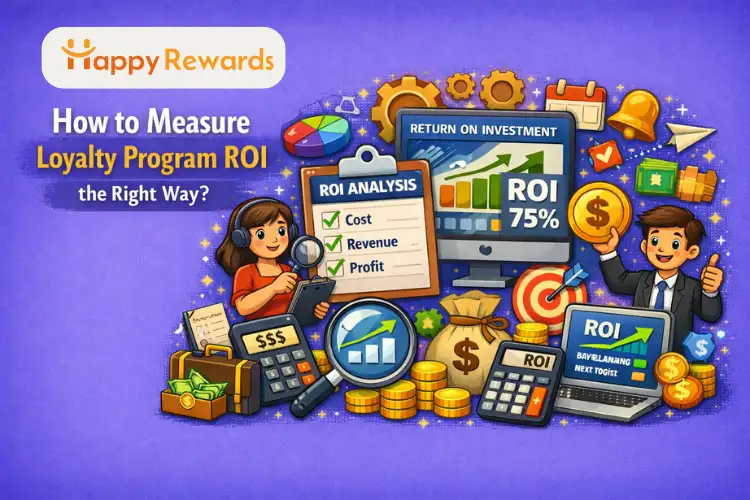
How to Measure Loyalty Program ROI the Right Way?
Your marketing team spent three months building a loyalty program. You’ve got a shiny point system, a tiered rewards structure, beautiful email campaigns the works. Six months in, your CEO slides into your Slack and asks: “So… is this actually paying off?”
If your answer is a nervous “we think so?” you’re not alone. According to a 2024 EY Loyalty Market Study, 41% of corporate loyalty leaders openly admit they struggle to quantify the overall impact of their loyalty programs. And yet, those same programs are shaping customer behavior, driving repeat purchases, and building brand affinity every single day.
The good news? Measuring Loyalty Program ROI doesn’t have to feel like reading tea leaves. When you know which metrics to track, which costs to account for, and how to isolate true incremental impact the numbers start to tell a very clear story. A story, frankly, that usually has a very happy ending.
In this guide, we’re going to walk through exactly how to do that from setting the right goals to tracking the KPIs that actually matter, measuring soft benefits, and avoiding the mistakes that distort your data. Let’s get into it. HappyRewards.io makes tracking the ROI easy with its dashboard.
What Is Loyalty Program ROI And Why Is It Harder to Measure Than It Looks?
At its core, Loyalty Program ROI answers one simple question: for every dollar you put into your loyalty program, how many dollars do you get back? Simple concept. Trickier in practice and here’s why.
The basic formula looks like this:
The Core ROI Formula
ROI = (Gross Profit from Program – Program Costs) ÷ Program Costs × 100
Program Costs include: Software Platform Fees + Cost of Rewards + Program Management Costs + Marketing Automation expenses
Straightforward on paper. But here’s where businesses trip up: loyalty is a long-term investment. Unlike a paid ad that converts or doesn’t within 48 hours, a loyalty program builds customer behavior over months and years. The revenue it generates doesn’t always show up in the same quarter you invest in it.
There are also hidden costs that brands often forget to factor in. Program Liabilities the unredeemed points sitting in your members’ accounts are a real financial obligation. When customers do eventually redeem them, that cost hits your books.
Ignoring this concept of Point Breakage (points that expire or are never redeemed) gives you a rosier picture of your Net Profit Margin than reality warrants.
A sound approach to Financial Modeling for loyalty means accounting for all of it the Hard Benefits (revenue, repeat purchases, reduced churn) and the less obvious liabilities before you can confidently call your program profitable. A good rule of thumb is to define your Break-even Point upfront: at what level of member spend does the program begin to pay for itself?
Define What “Success” Looks Like Before You Start Measuring
Here’s a mistake that plays out in boardrooms all the time: a team launches a loyalty program, tracks a handful of metrics, and then debates endlessly about whether the numbers are good or bad because nobody defined “good” before the program went live.
ROI is only meaningful when it’s tied to outcomes that actually matter to your specific business. A fashion retailer running a tiered rewards program to reduce seasonal churn has completely different success metrics than a SaaS company using a membership program to increase feature adoption. Define what success looks like for your brand first, because ROI is only meaningful when tied to outcomes that matter.
Think of loyalty goals in three buckets:
Retention-Focused Programs
These are built to reduce Churn Rate and deepen Customer Retention. If your program exists primarily to keep customers from leaving, your headline KPIs should be Retention Rate, Churn Reduction, and Repeat Purchase Rate (RPR).
You want to see these numbers moving in the right direction quarter over quarter. Think of brands like Sephora Beauty Insider their entire model is built around giving members reasons to stay, not just reasons to buy once.
Revenue-Focused Programs
Some brands use loyalty as a pure revenue engine designed to increase Average Order Value (AOV), boost Purchase Frequency, and generate Incremental Sales Lift. If this is your goal, the question you’re answering with ROI is: “Are loyalty members actually spending more than they would have without the program?”
Engagement-Focused Programs
These programs are designed to go deeper than transactions building Emotional Loyalty and Behavioral Loyalty simultaneously.
Success here means a high Member Participation Rate, growing Brand Advocacy, and strong Customer Engagement Metrics across channels. Think points for reviews, referrals, social shares transactional loyalty evolving into genuine community.
Once your goals are locked in, your measurement framework practically writes itself. You stop measuring everything and start measuring the right things. Speaking of which, here are the core KPIs that give loyalty ROI its backbone.
The Core KPIs That Actually Tell the Loyalty ROI Story
You could track 50 metrics. Or you could track the six that genuinely move the needle. Here’s the short list and what to do with each one.
1. Customer Lifetime Value (CLV)
Customer Lifetime Value is the total revenue you can expect from a single customer over their entire relationship with your brand. It’s arguably the most important number in your loyalty dashboard. Talon.One identifies CLV as the most useful single metric for understanding the value each customer brings to your business.
Formula: CLV = Average Purchase Value × Purchase Frequency × Customer Lifespan
The real power of CLV in loyalty ROI measurement? Compare it between members vs. non-members. If your loyalty members have a CLV of $480 and non-members average $290, that $190 delta is the financial story your program is telling. Research shows loyalty programs can lift LTV by 20–50% when done well.
2. Customer Retention Rate (CRR) & Repeat Purchase Rate (RPR)
Customer Retention is where loyalty programs live or die. Research consistently shows that just a 5% increase in retention can boost profits by 25–95%. Why? Because keeping an existing customer is 5–25 times cheaper than winning a new one.
CRR Formula: [(Customers at End of Period – New Customers) ÷ Customers at Start] × 100
RPR Formula: (Repeat Customers ÷ Total Customers) × 100
Track both together. CRR tells you how many people are sticking around; RPR tells you how often they’re coming back to buy. A program hitting both is firing on all cylinders. Pair these with your Churn Reduction numbers to show leadership the program’s direct impact on customer loss prevention. You can learn more about how HappyReward.io helps brands reduce churn through smarter customer retention strategies.
3. Average Order Value (AOV)
Loyal members don’t just come back more often they spend more when they do. This is where Average Order Value (AOV) becomes a powerful ROI indicator. Well-designed loyalty programs naturally create upselling and cross-selling moments a member who’s 200 points away from a reward tier is far more likely to add one more item to their cart.
Compare AOV monthly between loyalty members and non-members. If you see a consistent lift even 10–15% that’s compounding revenue impact at scale. HappyReward.io’s tiered rewards programs are specifically designed to nudge AOV upward at each level.
4. Purchase Frequency
How often are your loyalty members buying? Purchase Frequency is one of the clearest signs of a healthy program. A member who visits 4 times a month instead of once isn’t just 4x more valuable in transactions they’re building a behavioral habit around your brand, and that habit is incredibly sticky.
For deeper insight, combine Purchase Frequency data with RFM Analysis (Recency, Frequency, Monetary) a proven framework for Customer Segmentation that lets you identify which members are thriving, which are at risk of going dormant, and which deserve a VIP upgrade. This is where gamification elements like leaderboards and progression bars can really earn their keep by motivating higher frequency.
5. Reward Redemption Rate
Here’s a metric that functions like a pulse check on your entire program. Redemption Rate measures the percentage of earned loyalty points or rewards that members actually use. According to Antavo’s Global Customer Loyalty Report 2025, loyalty programs on average generate 5.2X more revenue than they cost but that return hinges on members actually engaging with the rewards on offer.
A low redemption rate is a warning sign: members aren’t finding the reward catalog compelling, or the points threshold feels too far away to motivate action. A high rate signals genuine engagement and yes, it increases your Cost of Rewards in the short term, but it’s the kind of cost that signals a healthy, working program. Watch Point Breakage as a counterpoint if too many points expire unredeemed, that’s disengagement, not savings.
6. Customer Acquisition Cost (CAC) vs. Retention Cost
Customer Acquisition Cost (CAC) has risen nearly 60% over the last five years, driven by rising ad costs and platform competition. This is the most compelling business case for loyalty: every dollar spent retaining an existing customer through a loyalty program goes further than a dollar spent trying to win a new one.
Calculate your CAC, then compare it against your per-member retention cost. Most brands find the ratio is shocking in a very good way. This comparison alone is often enough to justify the loyalty program budget to any skeptical CFO.
These six KPIs give you a robust, data-driven view of your program’s financial performance. But here’s the thing they only tell half the story. The other half lives in the territory of feelings, perceptions, and relationships. And those matter just as much.
Don’t Ignore “Soft” ROI The Intangible Benefits That Compound Over Time
Let’s tell a quick story. A coffee brand launched a simple points-based loyalty program nothing fancy. Within a year, their NPS score jumped 18 points. Their social mentions doubled. And their Referral Revenue driven almost entirely by word-of-mouth from loyal members was generating more new customers than their paid ad budget. None of that showed up in a standard ROI formula. But all of it was real.
EY’s research is clear: businesses must quantify intangible benefits like Brand Advocacy, improved Customer Experience (CX), and customer satisfaction alongside financial KPIs because they are critical components of sustained business success.
Net Promoter Score (NPS)
Net Promoter Score (NPS) asks one deceptively simple question: “How likely are you to recommend us to a friend?” Loyalty program members with high NPS scores are your most valuable marketing asset.
They’re generating organic growth through brand advocacy that no ad budget can replicate. Track NPS specifically for loyalty members vs. general customers the gap tells you how much your program is deepening emotional connection to your brand.
Customer Satisfaction (CSAT) & Brand Affinity
Customer Satisfaction (CSAT) scores tied to loyalty interactions reward redemptions, tier upgrades, birthday rewards reveal whether your program is creating moments of delight or moments of friction.
A member who gets a seamless, personalized experience walks away with stronger brand affinity and brand trust. One who struggles to redeem a reward walks away with neither.
Referral Revenue & Social Proof
When members with genuine Emotional Loyalty refer friends, that’s Referral Revenue that costs you almost nothing to generate. Track referrals from loyalty members separately, using UTM parameters or unique promo codes.
This revenue attribution is often one of the biggest surprises brands discover when they start measuring soft ROI properly. It’s also the engine behind the brand community and social proof that makes your brand magnetic to new customers.
Personalization Impact
McKinsey research shows personalization can lift revenues 5–15% and improve marketing efficiency 10–30%. Your loyalty program is a personalization goldmine member data lets you send the right offer to the right person at the right moment.
Through omnichannel marketing and behavioral triggers, you can measure the conversion delta between personalized loyalty offers and generic ones. Explore how HappyReward.io handles personalized loyalty programs for a practical playbook.
Soft ROI isn’t “nice to have” data it’s the part of the picture that explains why your hard numbers are moving the way they are. Together, they give you a complete view of your program’s value. But there’s still one more layer we need to peel back: making sure you’re measuring the right revenue.
How to Isolate Your Program’s True Impact? (This Is Where Most Brands Go Wrong)
Here’s the sneaky attribution problem that inflates loyalty ROI numbers across the industry. Most brands look at their loyalty members’ total spending and credit all of it to the program. The logic seems fine on the surface members are buying, so the program must be working, right?
Not so fast. Traditional methods ignore a crucial question: would these customers have purchased anyway, even without the program? When brands use AI-driven attribution to correct for this, they often find revenue inflation reduced by more than 50%. The real metric you want is Incremental Revenue the spending that happened because of the loyalty program, not just alongside it.
Step 1 Establish a Pre-Program Baseline
Before you can measure the program’s impact, you need to know what normal looked like before it existed. Pull historical data on Purchase Frequency, AOV, Retention Rate, and Churn Rate for the same customer cohorts. This baseline becomes your control benchmark anything above it, once you launch, is fair game to attribute to your program’s influence.
Step 2 Use A/B Testing and Control Groups
This is the gold standard approach. When onboarding new customers, split them into two groups: one gets full loyalty program access, the other doesn’t (or gets a watered-down version). Over a 90-day window, compare their Incremental Sales Lift, Retention Rate, AOV, and Purchase Frequency. The gap between those two groups is as close to a true measure of your program’s impact as you’ll ever get without a randomized controlled trial.
Step 3 Apply Financial Modeling to Calculate Incremental Margin
Once you’ve isolated your true incremental revenue, apply your average profit margin to calculate Incremental Margin the actual profit generated because of the loyalty program. Subtract all program costs (Software Platform Fees, Cost of Rewards, Program Management Costs, Marketing Automation) and you have a clean, defensible Loyalty Program ROI figure.
And don’t stop there. Use RFM Analysis (Recency, Frequency, Monetary) to segment your member base and run this calculation per segment.
High-value VIP members will show very different ROI than recently enrolled or dormant members and that insight directly informs your Re-engagement Campaigns and Win-back Strategies for lapsed members. Your CRM Integration and Data Analytics stack should make this kind of Customer Segmentation accessible without a team of data scientists.
Explore how HappyReward.io’s loyalty analytics dashboard makes this easier.
5 Common Mistakes That Distort Your Loyalty ROI Numbers
Even brands with great programs make measurement mistakes that either understate or overstate their ROI. Here are the five most common and how to sidestep each one.
❌ Mistake 1: Measuring Too Early
Loyalty ROI is a long game. Antavo’s research shows it typically takes 12–14 months for customers to engage deeply enough with a program to start redeeming rewards at meaningful levels. Judging your program at month two is like leaving the cinema 20 minutes in.
✅ Fix: Set a 90-day minimum evaluation window for behavioral data to normalize, and plan your first meaningful ROI review at the 6-month mark.
❌ Mistake 2: Counting All Member Revenue as Program Revenue
As we covered in Section 5, crediting every dollar a loyalty member spends to the program inflates your ROI dramatically. Your most loyal customers were probably buying from you before the program existed and would keep buying after it ended.
✅ Fix: Always measure Incremental Revenue against a control group baseline, not total member spending.
❌ Mistake 3: Forgetting Hidden Program Costs
Many brands calculate program costs as “what we spent on rewards.” That’s maybe 60% of the picture. Software Platform Fees, Program Management Costs, Program Liabilities (outstanding point balances), and the internal staff time managing the program all count. Forgetting them makes your ROI look far better than it is until someone actually digs into the numbers.
✅ Fix: Build a full cost model before calculating ROI. Include hard costs, staff time, tech costs, and expected point redemption liability.
❌ Mistake 4: Ignoring Soft Metrics Entirely
If you’re only tracking hard financial KPIs, you’re missing the part of the story that explains why your program will keep generating returns. NPS, CSAT, Brand Advocacy, and Referral Revenue from loyal members are all measurable they just require different tracking tools than a spreadsheet.
✅ Fix: Add a monthly soft-metric review to your loyalty reporting. Use post-redemption surveys and referral tracking tools to quantify what you’ve been leaving on the table.
❌ Mistake 5: No Regular Audits or Strategic Benchmarking
A loyalty program without regular review is a car without a dashboard. You might feel like you’re moving, but you have no idea how fast, in what direction, or whether the engine is about to fail. Strategic Benchmarking comparing your KPIs against industry standards and your own prior periods is what separates programs that keep improving from ones that quietly plateau. Learn how to conduct a proper loyalty audit with our loyalty program audit checklist.
✅ Fix: Schedule quarterly loyalty audits. Review all core KPIs, check Point Expiration patterns, assess Fraud Prevention measures, and compare performance to where you were 90 days prior.
Fixing these five mistakes doesn’t just improve your measurement accuracy it often reveals that your program is delivering significantly more value than you thought. And that brings us to the most important part of this whole conversation.
Conclusion
Measuring Loyalty Program ROI the right way means accepting that the full picture is more than one formula. It’s a combination of hard financial KPIs CLV, AOV, Retention Rate, Purchase Frequency, Redemption Rate layered with behavioral signals and soft benefits like NPS, Brand Advocacy, and Referral Revenue. And underpinning all of it is a clean, incremental attribution model that tells you what’s actually happening because of your program, not just alongside it.
When brands get this right, the results speak for themselves. Antavo’s 2025 Global Customer Loyalty Report found that well-measured and optimized loyalty programs generate an average of 5.2X ROI up from 4.8X the prior year. That’s not a coincidence. That’s what happens when brands stop guessing and start measuring.
The most successful loyalty programs in 2025 are built on Data Analytics, powered by CRM Integration and Marketing Automation, personalized at the member level, and reviewed consistently with a mix of hard and soft metrics.
They’re not set-and-forget campaigns they’re living systems that get smarter and more profitable over time. That’s the future of customer-centric growth. And it starts with measuring the right things.
Ready to Build a Loyalty Program That Actually Pays for Itself? HappyReward.io gives you the tools, analytics, and smart automation to launch, measure, and grow your loyalty ROI from day one.
